Figure
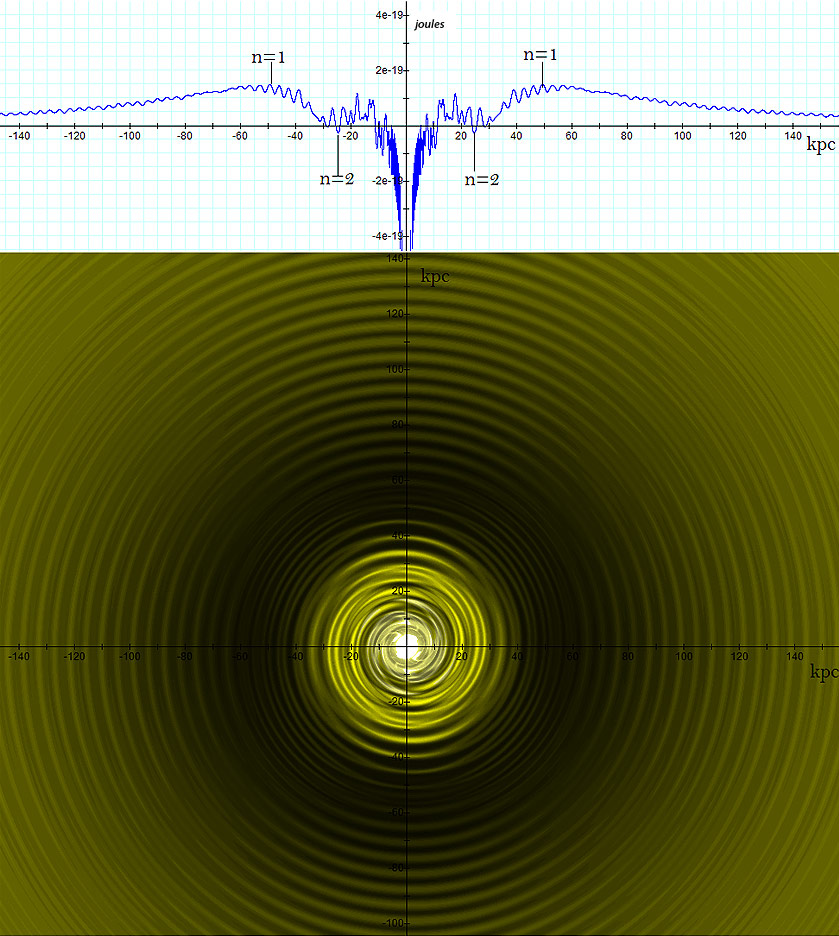
6-1: A galactic
spiral calculated via equation 4-1-1a using the parameters  , ,
 , ,
 , ,
 , ,
 , ,
 and
and  .
The lower image provides a two dimensional map of the potential
energy contours of an ordinary particle of mass .
The lower image provides a two dimensional map of the potential
energy contours of an ordinary particle of mass  ,
while the upper image of the figure displays its potential energy
curve along the ,
while the upper image of the figure displays its potential energy
curve along the  axis. As shown, the spiral structure does not end at the last
significant minimum contour
axis. As shown, the spiral structure does not end at the last
significant minimum contour  located at a radius of approximately
  ,
nor at the external zonal maximum ,
nor at the external zonal maximum  located at a radius of approximately
  to
to  ,
and is demonstrated to extend well beyond these major zones. Note
that as the distance between the ordinary test particle and the
center of the galaxy increases beyond the
maximum, the particles potential energy declines gradually and
eventually converges toward the Newtonian potential energy. When the
rotation of the spiral is viewed over time, the oscillations
displayed in the upper graph migrate outward, suggesting that the
orbiting ordinary particles may be led outward by the rotating
spiral, and eventually ejected out of the galaxy in the form of
galactic wind. ,
and is demonstrated to extend well beyond these major zones. Note
that as the distance between the ordinary test particle and the
center of the galaxy increases beyond the
maximum, the particles potential energy declines gradually and
eventually converges toward the Newtonian potential energy. When the
rotation of the spiral is viewed over time, the oscillations
displayed in the upper graph migrate outward, suggesting that the
orbiting ordinary particles may be led outward by the rotating
spiral, and eventually ejected out of the galaxy in the form of
galactic wind.
The purpose of this chapter is to further explore the interaction
between ordinary matter orbiting around the center of a spiral
galaxy and the rotating spiral structure. In the following section,
the large-scale potential energy spiral will be demonstrated to pump
out ordinary matter such as interstellar gas and dust to beyond the
 zonal maximum, creating the observed galactic outflow of gas. It
will further be shown that the rotating potential energy spiral bears
the effect of equalizing the velocity of orbiting
matter, resulting in the relatively constant rotation curve observed
in spiral galaxies. The critical influence of the rotating spiral on
star formation will be examined in the final section of this chapter.
zonal maximum, creating the observed galactic outflow of gas. It
will further be shown that the rotating potential energy spiral bears
the effect of equalizing the velocity of orbiting
matter, resulting in the relatively constant rotation curve observed
in spiral galaxies. The critical influence of the rotating spiral on
star formation will be examined in the final section of this chapter.
Section VI-1: The
Formation of Galactic Density Waves
The theory of unified gravitation proposes that density waves occur
due to the difference between the angular velocity of a rotating
zonal pattern and the angular velocity of an orbiting object. In
Chapter IV, the large-scale spiral structure was demonstrated to
rotate at the same angular velocity as the galactic core and its
superheavy particles. Following equation 4-1-1a, the potential
energy of the object in a galaxy generated by a single SHP or binary
SHP groups is given by Equation
4-1-1a
The variables used in the above equation are defined in Chapters III
and IV, and
 is equal to the mass of the ordinary matter enclosed in a sphere of
radius
is equal to the mass of the ordinary matter enclosed in a sphere of
radius
 around the galaxy center. Therefore,
 ,
where ,
where
 denotes the total mass of ordinary matter in the galaxy. As
 and
and
 are significantly larger than one parsec and
 is of the order of
 ,
the terms ,
the terms
 and
and
 are indistinguishable from
 .
Therefore, the maximum potential energy of the object is given by .
Therefore, the maximum potential energy of the object is given by
 ,
where ,
where
 and the minimum potential energy is given by
 .
In order to remain trapped within the galactic disk at .
In order to remain trapped within the galactic disk at
 ,
the total potential plus kinetic energy of the orbiting object must
fall somewhere between ,
the total potential plus kinetic energy of the orbiting object must
fall somewhere between
 and
and
 ,
leading to ,
leading to  ,
where ,
where
 is the velocity of the orbiting object. Therefore,
Equation
6-1a 
and
the maximum possible velocity for a trapped object is in the vicinity
of Equation
6-1b 
Thus,
the upper bound of the velocity possible for an orbiting object is
 .
Since
,
the ratio between the angular velocity of the spiral pattern .
Since
,
the ratio between the angular velocity of the spiral pattern
 and the maximum angular velocity
 is given by
 Equation
6-2a 
as
long as
 .
Therefore, .
Therefore,
 increases linearly with
for any value
and
increases linearly with
for any value
and
 .
The corotation radius .
The corotation radius
 ,
defined as the radial distance at which the velocity of the orbiting
objects is equal to the angular velocity of the central core and the
SHP groups, occurs when ,
defined as the radial distance at which the velocity of the orbiting
objects is equal to the angular velocity of the central core and the
SHP groups, occurs when
 ,
and is therefore given by ,
and is therefore given by Equation
6-2b 
Consequently,
particles or objects with orbital radii larger than
can no longer keep up with
and begin to lag behind the rotation rate of the zonal pattern.
Figure 6-2 provides the graphic solution of the equation for
for the case of a galaxy with a spherically symmetric distribution of
ordinary matter of mass
 contained within a radius
 from the center of the galaxy (therefore,
is assumed to be virtually equal to the total mass of the galaxy for
all distances
from the center of the galaxy (therefore,
is assumed to be virtually equal to the total mass of the galaxy for
all distances
 ).
The given galaxy is assumed to contain a single SHP group of ).
The given galaxy is assumed to contain a single SHP group of
 superheavy particles of particle mass
 rotating at a speed of rotating at a speed of
 in a circular orbit of radius of
 around the center of the galaxy. In this figure, the functions
 (in violet) and
 (in red, using
 )
were drawn to provide )
were drawn to provide
 when
when
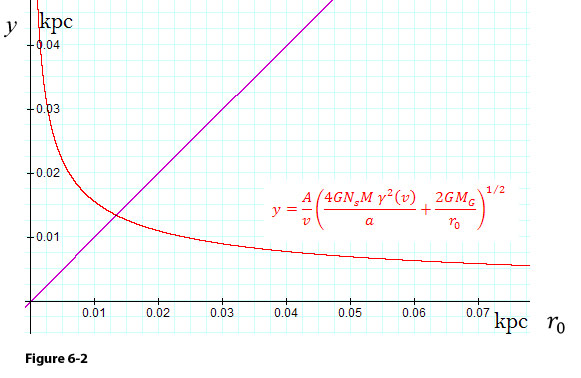 The
pattern speed in this example is given by
 .
It would take the pattern .
It would take the pattern
 years to complete one full rotation, while a star moving at a speed
of
years to complete one full rotation, while a star moving at a speed
of
 relative to the galaxy center in a circular orbit of radius of
 requires as many as 245.78 million years to complete a full rotation.
Section
VI-2: The Outflow of Gas and Matter From Galaxies
As shown above, at distances of
 the spiral maxima and minima rotate faster than the given ordinary
object, and therefore overtake its orbit on a periodic basis. When
the objects initial potential plus kinetic energy just prior
to an encounter with a rotating maximum contour is lower than its
potential energy at that maximum, the potential plus the kinetic
energy of the object must be elevated to match or exceed its
potential energy at the maximum. In addition, the rotating spiral
applies a greater than zero net tangential force on the rotating
object along its direction of movement, thereby resulting in a
non-zero net work and in increasing the objects energy with
every full spiral rotation.1
Unless the object loses this added energy via other interactions in
between successive encounters, its energy level will steadily
increase. The objects potential plus kinetic energy is thus
expected to eventually exceed its potential energy at the highest
maximum
,
and consequently the object will exit the galaxy.
the spiral maxima and minima rotate faster than the given ordinary
object, and therefore overtake its orbit on a periodic basis. When
the objects initial potential plus kinetic energy just prior
to an encounter with a rotating maximum contour is lower than its
potential energy at that maximum, the potential plus the kinetic
energy of the object must be elevated to match or exceed its
potential energy at the maximum. In addition, the rotating spiral
applies a greater than zero net tangential force on the rotating
object along its direction of movement, thereby resulting in a
non-zero net work and in increasing the objects energy with
every full spiral rotation.1
Unless the object loses this added energy via other interactions in
between successive encounters, its energy level will steadily
increase. The objects potential plus kinetic energy is thus
expected to eventually exceed its potential energy at the highest
maximum
,
and consequently the object will exit the galaxy.
In figure 6-3, the maxima of the relativistic oscillations beyond
decline with increasing distance and cannot confine the object, which
breaks free and flies out in the tangential direction away from the
galaxy. A collective outward flow of galactic matter may explain the
observed large-scale outflow of gas from galaxies.
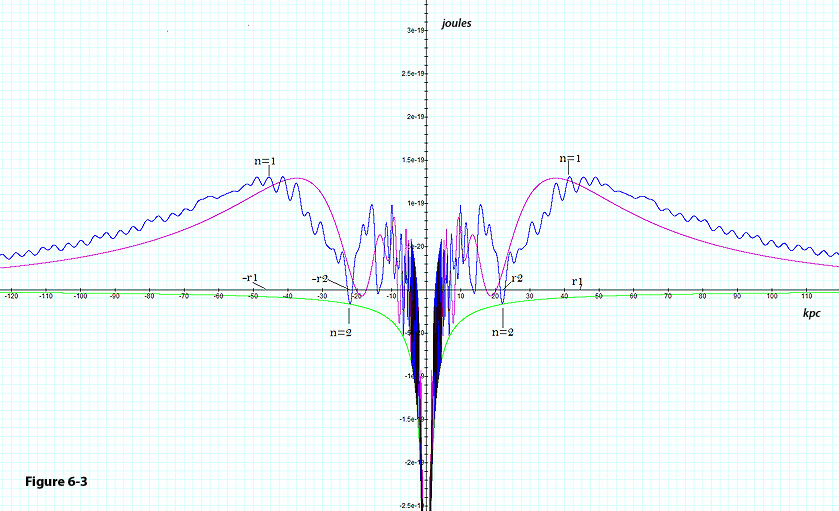 
Figure
6-3: Provides the
gravitational potential energy along the x
axis between an ordinary particle of mass
and the binary SHP groups
of a galaxy, described by the parameters  ,
,
,
and ,
,
,
and  .
Given non-relativistic SHP
velocities of .
Given non-relativistic SHP
velocities of  ,
the potential energy derived via equation 4-1-1a demonstrates a
long and steady decline beyond the
maximum (in violet) toward the ,
the potential energy derived via equation 4-1-1a demonstrates a
long and steady decline beyond the
maximum (in violet) toward the  potential energy minimum. However, at a relativistic SHP
velocity of
potential energy minimum. However, at a relativistic SHP
velocity of  ,
the potential energy (in blue) provides outward propagating
oscillations well beyond the external zonal maximum ,
while the
maximum contour shifts outward. ,
the potential energy (in blue) provides outward propagating
oscillations well beyond the external zonal maximum ,
while the
maximum contour shifts outward.
As the objects energy increases gradually over time, the
objects potential plus kinetic energy at the time it crosses
the
maximum and escapes the galaxy is approximately equal to the objects
potential energy at this maximum (thus the kinetic energy of the
object at this point is close to zero). Therefore, at
 and
and
 ,
the average overall potential plus kinetic energy of the object at
the exact time of intersection with the zonal maximum
is given by ,
the average overall potential plus kinetic energy of the object at
the exact time of intersection with the zonal maximum
is given by
 .
After breaking away, the overall energy level of the test object
remains approximately unchanged (assuming only a small contribution
from other galaxies and minor SHP groups). At distances .
After breaking away, the overall energy level of the test object
remains approximately unchanged (assuming only a small contribution
from other galaxies and minor SHP groups). At distances
 ,
where the SHP contribution becomes negligible, the objects
kinetic energy is equal to ,
where the SHP contribution becomes negligible, the objects
kinetic energy is equal to 
Consequently,
the velocity of the galactic gas outflow
 can be expected to approach
 Equation
6-3a 
The
approximate radius of the first maximum contour is given by
 ,
where ,
where
 is equal to the approximate radius of the outermost substantial
minimum contour, or roughly the radius of the galactic disk.
Substituting
is equal to the approximate radius of the outermost substantial
minimum contour, or roughly the radius of the galactic disk.
Substituting
 for for
 and
and
 for for in equation 6-3a,2
the speed of the ejected test object at far greater distances from
the galaxy can also be written as
in equation 6-3a,2
the speed of the ejected test object at far greater distances from
the galaxy can also be written as Equation
6-3b 
This
process provides a possible explanation for the mechanism that drives
the galactic outflow of gas and determines its velocity. Note that
if the galaxy center contains a substantial amount of additional
smaller SHPs (at sufficient quantity that their overall mass is
larger than or comparable to
 ),
other outflow velocities may be detected. Such a phenomenon is
observed in the Solar System, where solar wind is observed to have
two different speeds at about ),
other outflow velocities may be detected. Such a phenomenon is
observed in the Solar System, where solar wind is observed to have
two different speeds at about
 and
and
 ,
suggesting significant contribution from at least two different SHP
types. ,
suggesting significant contribution from at least two different SHP
types.
Section
VI-3: The Constant Galaxy Rotation Curve
According
to Newtons theory of gravitation, one might expect that the
speed of a star rotating beyond the main body of a galaxy mass should
decrease inversely to the square root of the stars orbital
radius. Mathematically stated, Equation
6-4 
Accordingly, at
distances where
 ,
stars at the outer edge of a galactic disk would be expected to
travel at much lower velocities than those near the middle. However,
measurements of the rotation curves of a number of known spiral
galaxies have demonstrated significant departure from the velocities
predicted by Newtonian gravitation. Rather, stellar velocity was
observed to remain roughly constant, or in some cases to increase
slightly with distance from the center. To date, the theory of dark
matter is the leading explanation for the galaxy rotation problem.
Current theories predict that dark matter should account for about ,
stars at the outer edge of a galactic disk would be expected to
travel at much lower velocities than those near the middle. However,
measurements of the rotation curves of a number of known spiral
galaxies have demonstrated significant departure from the velocities
predicted by Newtonian gravitation. Rather, stellar velocity was
observed to remain roughly constant, or in some cases to increase
slightly with distance from the center. To date, the theory of dark
matter is the leading explanation for the galaxy rotation problem.
Current theories predict that dark matter should account for about
 of the mass of the observable universe, compared with only about
 estimated for baryonic matter.3
As of yet, however, there is no direct evidence for the existence of
dark matter, nor any clear and accepted theory that explains what
exactly this matter is, what determines its distribution in galaxies
and in the universe, why it has so little presence, if at all, within
our Solar System, or how it influences galactic morphology. The
hypothesis that the constant rotation curve observed in spiral
galaxies is due to a massive dark halo surrounding a spiral disk
allows Newtons gravitational theory to hold over cosmological
scale distances. Consequently, most astronomers and physicists
prefer this explanation to the alternative, that Newtonian dynamics
require modification for application over cosmological distances.4
estimated for baryonic matter.3
As of yet, however, there is no direct evidence for the existence of
dark matter, nor any clear and accepted theory that explains what
exactly this matter is, what determines its distribution in galaxies
and in the universe, why it has so little presence, if at all, within
our Solar System, or how it influences galactic morphology. The
hypothesis that the constant rotation curve observed in spiral
galaxies is due to a massive dark halo surrounding a spiral disk
allows Newtons gravitational theory to hold over cosmological
scale distances. Consequently, most astronomers and physicists
prefer this explanation to the alternative, that Newtonian dynamics
require modification for application over cosmological distances.4 Whereas the Newtonian
rotation curve of equation 6-4 drops proportionally to  ,
the UG rotation curve of equation 6-1a limits the speed of a rotating
object to the range of ,
the UG rotation curve of equation 6-1a limits the speed of a rotating
object to the range of within the oscillation range of
 and and at distances
 .
Therefore, at relatively short distances5 .
Therefore, at relatively short distances5 , ,
 and and
 ,
the rotation curve increases proportionally to ,
the rotation curve increases proportionally to
 ,
in agreement with observations (see figure 6-5c at distances ,
in agreement with observations (see figure 6-5c at distances
 ).
At distances ).
At distances
 ,
where ,
where
 and
,
the velocity of the orbiting object becomes
and
,
the velocity of the orbiting object becomes
 . .
At distances
 and
and
 ,
the maxima and minima contours of both SHP groups (in the case of
binary groups) almost coincide, and the contribution of ordinary
matter is relatively small. Therefore, all the potential energy
maxima within this range of distances demonstrate approximately the
same potential energy of ,
the maxima and minima contours of both SHP groups (in the case of
binary groups) almost coincide, and the contribution of ordinary
matter is relatively small. Therefore, all the potential energy
maxima within this range of distances demonstrate approximately the
same potential energy of
 ,
and all of the minima within this range have a potential energy of
virtually zero joules or electron-volts (note that the external
maximum
is slightly higher than the rest of the maxima within this range of
distances and can thus contain the object within the galaxy). ,
and all of the minima within this range have a potential energy of
virtually zero joules or electron-volts (note that the external
maximum
is slightly higher than the rest of the maxima within this range of
distances and can thus contain the object within the galaxy).
When
 ,
the spiral rotates faster than the ordinary object around the center
of the galaxy, and therefore the overall potential plus kinetic
energy of the object must be elevated during its periodic encounters
with the spirals local maxima to match or slightly exceed the
highest potential energy encountered by the object. As the potential
energy maxima are virtually equal, and the object remains trapped
within the galaxy, its energy must be close to
.
Therefore, the kinetic energy of the orbiting object will
periodically approach zero upon encounter with a maximum contour in
this range of distances, while upon encountering a minimum, the
objects velocity becomes ,
the spiral rotates faster than the ordinary object around the center
of the galaxy, and therefore the overall potential plus kinetic
energy of the object must be elevated during its periodic encounters
with the spirals local maxima to match or slightly exceed the
highest potential energy encountered by the object. As the potential
energy maxima are virtually equal, and the object remains trapped
within the galaxy, its energy must be close to
.
Therefore, the kinetic energy of the orbiting object will
periodically approach zero upon encounter with a maximum contour in
this range of distances, while upon encountering a minimum, the
objects velocity becomes 
where
 and and
 .
As the zonal spiral rotates, the object encounters an equal number
of potential energy maxima and minima. Since matter tends to
gravitate toward the minima potential energy, the object spends
longer periods of time near the minima than near the maxima or near
any other potential energy level in between. For this reason, the
density of matter near the minima is far greater than the density of
matter near the maxima. Most of the observed radiation generated by
the galactic gas is therefore likely to have originated at or near
the potential minima locations, where the velocity of the object is
given approximately by .
As the zonal spiral rotates, the object encounters an equal number
of potential energy maxima and minima. Since matter tends to
gravitate toward the minima potential energy, the object spends
longer periods of time near the minima than near the maxima or near
any other potential energy level in between. For this reason, the
density of matter near the minima is far greater than the density of
matter near the maxima. Most of the observed radiation generated by
the galactic gas is therefore likely to have originated at or near
the potential minima locations, where the velocity of the object is
given approximately by
 .
Consequently, the spectrum of the radiation emitted by the objects
atoms appears redshifted when the matter moves away from the
observer, or blue-shifted when the matter moves toward the observer,
and is strongly skewed toward the shift associated with the velocity
of the object at the minima
.
Note that .
Consequently, the spectrum of the radiation emitted by the objects
atoms appears redshifted when the matter moves away from the
observer, or blue-shifted when the matter moves toward the observer,
and is strongly skewed toward the shift associated with the velocity
of the object at the minima
.
Note that is constant and independent of both the mass of the object as well as
its distance from the center of the galaxy. As the minima are
generally circular, the velocity of the object is almost tangential.
Therefore, the spectral redshift or blueshift at the large distance
range observed is of a relatively flat velocity curve.
is constant and independent of both the mass of the object as well as
its distance from the center of the galaxy. As the minima are
generally circular, the velocity of the object is almost tangential.
Therefore, the spectral redshift or blueshift at the large distance
range observed is of a relatively flat velocity curve.
Between the small and large-scale distances, there is a mid-range of
distances at which
 , ,
 is
of the order of is
of the order of
 ,
and ,
and
 is almost independent of
.
At these distance ranges, the potential energy maxima and minima of
the mid-range distances vary, and generally increase with distance.
To analyze the velocity curve within this range in detail, the
process described above can be repeated. Over time, the orbiting
object drifts outward as its energy level increases due to the energy
transferred to the object by the rotating spiral. Therefore, the
overall potential plus kinetic energy of the object must be equal to
or slightly higher than the highest energy maximum encountered by the
object up to that point in time on its journey outward.6
is almost independent of
.
At these distance ranges, the potential energy maxima and minima of
the mid-range distances vary, and generally increase with distance.
To analyze the velocity curve within this range in detail, the
process described above can be repeated. Over time, the orbiting
object drifts outward as its energy level increases due to the energy
transferred to the object by the rotating spiral. Therefore, the
overall potential plus kinetic energy of the object must be equal to
or slightly higher than the highest energy maximum encountered by the
object up to that point in time on its journey outward.6 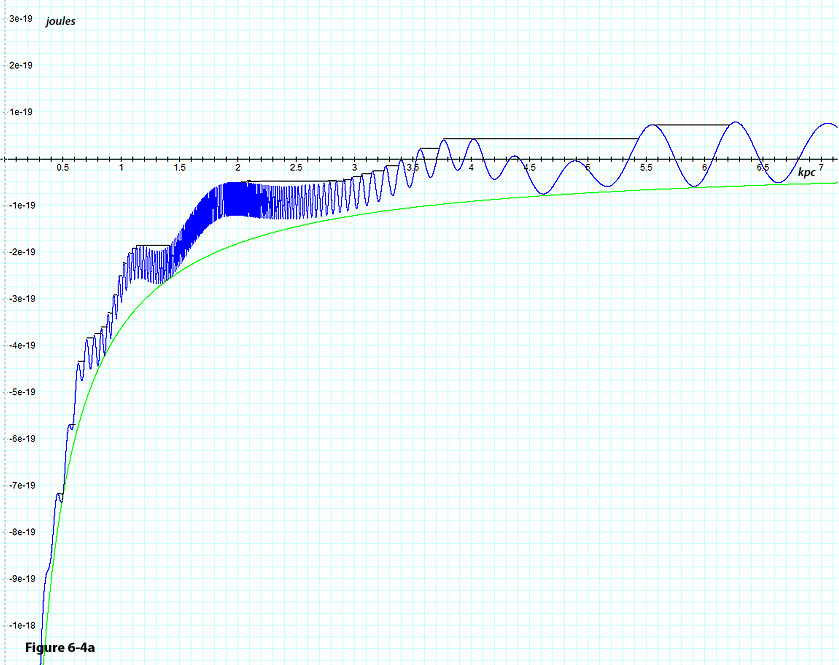
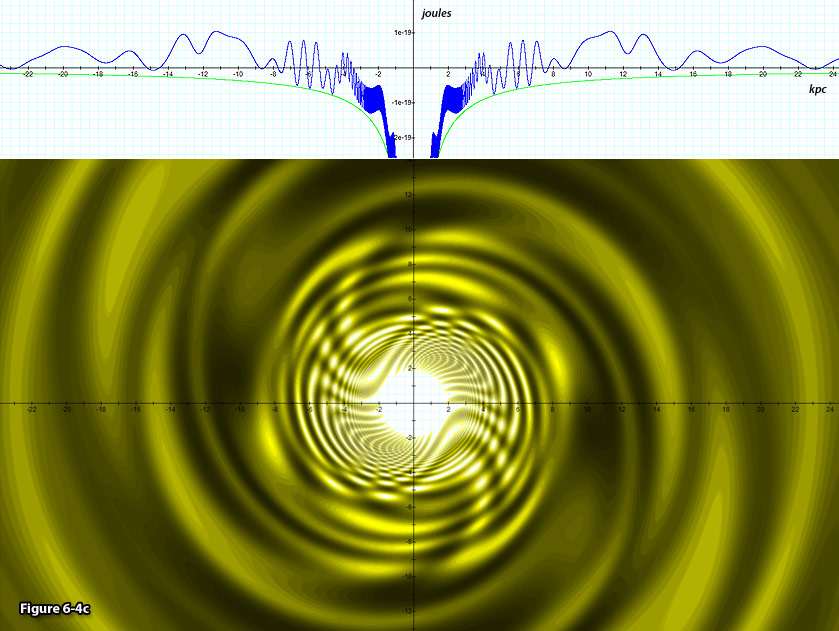
Figure
6-4c:Depicts a two
dimensional contour map of the same galaxy provided in figures 6-4a
and b, where the brighter colors
denote lower potential energy of the test object.
Based on the above discussion, the potential plus the kinetic energy
of the object as a function of the distance from the galaxy center is
presented in figures 6-4a, 6-4b and 6-4c for the case of a single
ordinary particle of mass
 within a galaxy containing identical binary SHP groups
 ,
each composed of a single SHP of mass ,
each composed of a single SHP of mass
 ,
rotating at constant speed ,
rotating at constant speed
 in a circular orbit of radius
around the galaxy center. The mass of the ordinary matter at the
center of the galaxy (within few parsecs) was selected to equal
in a circular orbit of radius
around the galaxy center. The mass of the ordinary matter at the
center of the galaxy (within few parsecs) was selected to equal
 .
Figure 6-4c provides a two dimensional contour map of the potential
energy of the test particle, as well as an additional perspective of
the same galaxy displayed in a one dimensional graph of the
particles potential energy along the .
Figure 6-4c provides a two dimensional contour map of the potential
energy of the test particle, as well as an additional perspective of
the same galaxy displayed in a one dimensional graph of the
particles potential energy along the
 axis.7
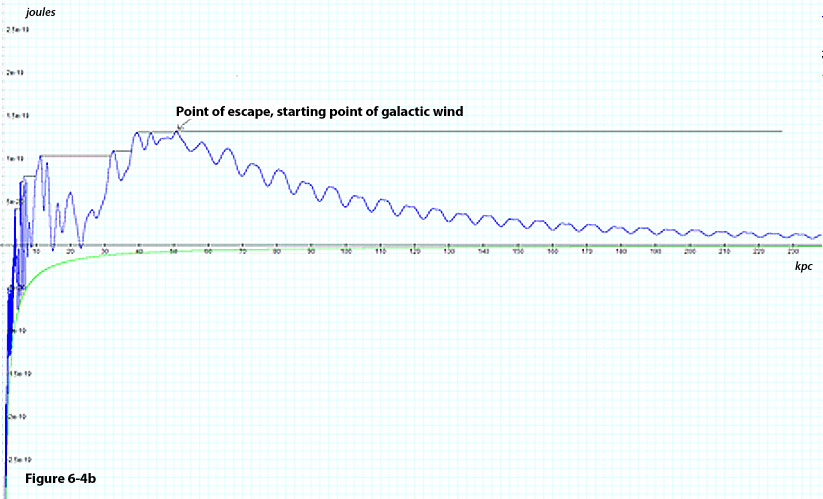
Detailed waveforms of the one dimensional graph are provided in
figures 6-4a (for
axis.7
Detailed waveforms of the one dimensional graph are provided in
figures 6-4a (for
 to
to
 )
and 6-4b (for
to )
and 6-4b (for
to
 ).
The green curves in these figures provide the contribution of the
galaxys ordinary matter to the overall potential energy. The
blue curve provides the overall potential energy contributed by the
relativistic SHP groups and by the galaxys ordinary matter.
The black lines provide the approximate overall potential plus
kinetic energy of the object. Note that the overall potential plus
kinetic energy of the object remains almost constant at the level of
the highest maximum peak previously encountered by the object, with a
slight positive slope.8
Upon a successive encounter with a higher energy maximum, the
objects energy level will abruptly increase to match the
potential energy of the new maximum peak. This is reflected by a
step increase between successive black lines, which are connected via
a short segment of the blue potential energy curve. Consequently,
the local velocity of the object at the time of the emittance of a
photon varies between ).
The green curves in these figures provide the contribution of the
galaxys ordinary matter to the overall potential energy. The
blue curve provides the overall potential energy contributed by the
relativistic SHP groups and by the galaxys ordinary matter.
The black lines provide the approximate overall potential plus
kinetic energy of the object. Note that the overall potential plus
kinetic energy of the object remains almost constant at the level of
the highest maximum peak previously encountered by the object, with a
slight positive slope.8
Upon a successive encounter with a higher energy maximum, the
objects energy level will abruptly increase to match the
potential energy of the new maximum peak. This is reflected by a
step increase between successive black lines, which are connected via
a short segment of the blue potential energy curve. Consequently,
the local velocity of the object at the time of the emittance of a
photon varies between
  and
and
 ,where
denotes the highest potential energy encountered thus far by the
object. ,where
denotes the highest potential energy encountered thus far by the
object.
 and
and
 respectively provide the local maximum and minimum potential energy
encountered at the given time. The value and the direction of
respectively provide the local maximum and minimum potential energy
encountered at the given time. The value and the direction of
 determine the amount of redshift or blueshift of the photon when
intercepted by the observer. As discussed above, the density of
matter tends to be significantly higher at the potential energy
minima, thus the distribution of the velocity
determine the amount of redshift or blueshift of the photon when
intercepted by the observer. As discussed above, the density of
matter tends to be significantly higher at the potential energy
minima, thus the distribution of the velocity
 is skewed strongly toward
.
Hence, the spectrum of the radiation emitted by the objects
atoms appears redshifted when matter is moving away from the observer
or blueshifted when matter is moving toward the observer, and
strongly skewed toward a wavelength shift associated with the
velocity of
is skewed strongly toward
.
Hence, the spectrum of the radiation emitted by the objects
atoms appears redshifted when matter is moving away from the observer
or blueshifted when matter is moving toward the observer, and
strongly skewed toward a wavelength shift associated with the
velocity of
Equation
6-5 
where
 .
As aforementioned, for distances .
As aforementioned, for distances
 or
or
 ,
the velocity of the object is given by ,
the velocity of the object is given by
 .
Due to this concept, the rotation curve of the modeled galaxy was
calculated by subtracting the potential energy waveform (the blue
curve) from the potential plus kinetic energy waveform (indicated in
black) displayed in figures 6-4a and 6-4b. Based on the above
discussion, the overall potential plus kinetic energy is determined
mainly by the highest maxima encountered prior to the given point in
time
.
As long as no higher maximum is encountered, the energy of the
particle will increase only slightly with each rotation of the
spiral, thus remaining nearly constant. However, upon encountering a
higher maximum
,
the potential plus kinetic energy of the object will increase to the
level of
,
as demonstrated by the series of black lines in the figures. The
calculated radius and potential energy of the maxima and minima shown
in figures 6-4a and 6-4b are respectively provided in the columns x,
and
of table 6-1. The Delta column of the table provides the
approximately calculated kinetic energy of the object upon
encountering the minima of the spiral, given by .
Due to this concept, the rotation curve of the modeled galaxy was
calculated by subtracting the potential energy waveform (the blue
curve) from the potential plus kinetic energy waveform (indicated in
black) displayed in figures 6-4a and 6-4b. Based on the above
discussion, the overall potential plus kinetic energy is determined
mainly by the highest maxima encountered prior to the given point in
time
.
As long as no higher maximum is encountered, the energy of the
particle will increase only slightly with each rotation of the
spiral, thus remaining nearly constant. However, upon encountering a
higher maximum
,
the potential plus kinetic energy of the object will increase to the
level of
,
as demonstrated by the series of black lines in the figures. The
calculated radius and potential energy of the maxima and minima shown
in figures 6-4a and 6-4b are respectively provided in the columns x,
and
of table 6-1. The Delta column of the table provides the
approximately calculated kinetic energy of the object upon
encountering the minima of the spiral, given by
 ,
and the column ,
and the column
 provides the Newtonian potential energy of the galaxys
ordinary matter (indicated in green in figures 6-4a and 6-4b). Bear
in mind that the waveforms and the two dimensional map of figures
6-4a to 6-4c (and therefore the set of values
and
in table 6-1) were calculated under the assumption that each group
contains a single SHP, and that the total mass of ordinary matter in
the galaxy
provides the Newtonian potential energy of the galaxys
ordinary matter (indicated in green in figures 6-4a and 6-4b). Bear
in mind that the waveforms and the two dimensional map of figures
6-4a to 6-4c (and therefore the set of values
and
in table 6-1) were calculated under the assumption that each group
contains a single SHP, and that the total mass of ordinary matter in
the galaxy
 is concentrated mainly in a sphere of radius
 .
According to equation 4-1-1a (as well as to the second scaling
theorem of the UG theory provided in appendix A), galactic
morphology will remain unchanged as the number of superheavy
particles in each SHP group and the mass of the ordinary matter
are multiplied by the same value .
According to equation 4-1-1a (as well as to the second scaling
theorem of the UG theory provided in appendix A), galactic
morphology will remain unchanged as the number of superheavy
particles in each SHP group and the mass of the ordinary matter
are multiplied by the same value
 ,
while the potential energy and velocity of the object increase by a
factor of
and ,
while the potential energy and velocity of the object increase by a
factor of
and
 respectively. For example, selecting
 will result in a total of
 superheavy particles, and an overall ordinary matter mass of
 .
With this choice of
,
the galaxy rotation curve expected according to Newtonian dynamics
via equations 6-4 (multiplied by
)
and the overall UG rotation curve (which includes both the
contribution of the galactic SHP groups and the contribution of
ordinary matter calculated via .
With this choice of
,
the galaxy rotation curve expected according to Newtonian dynamics
via equations 6-4 (multiplied by
)
and the overall UG rotation curve (which includes both the
contribution of the galactic SHP groups and the contribution of
ordinary matter calculated via
 )
are provided in the last two columns of the table. Note that the
calculated velocities include a radial component as well. However,
the assumption that the objects orbit is nearly circular
implies that its rotational velocity is nearly equal to its overall
velocity. )
are provided in the last two columns of the table. Note that the
calculated velocities include a radial component as well. However,
the assumption that the objects orbit is nearly circular
implies that its rotational velocity is nearly equal to its overall
velocity.
Figure 6-5a provides the graphs of the Newtonian (in blue) and the UG
(in red) galactic velocities, as derived from the last two columns of
table 1 and drawn as functions of the objects orbital radius.9
TABLE 6-1
x
(kpc)
|
Vmax
(joules)
|
Vi,min
(joules)
|
Delta
(joules)
|
|
VNewton
(joules)
|
x
(kpc)
|
u ordinary matter
(km/sec)
|
u overall
(km/sec)
|
|
0.375
|
|
|
0
|
no minima
|
-9.64E-19
|
0.375
|
301.7
|
0.0
|
|
0.4875
|
-7.16E-19
|
-7.42E-19
|
2.54E-20
|
|
-7.42E-19
|
0.4875
|
264.6
|
69.3
|
|
0.5768
|
-5.69E-19
|
-5.79E-19
|
9.99E-21
|
|
-6.27E-19
|
0.5768
|
243.2
|
43.4
|
|
0.6639
|
-4.37E-19
|
-4.74E-19
|
3.70E-20
|
|
-5.45E-19
|
0.6639
|
226.8
|
83.6
|
|
0.858
|
-3.64E-19
|
-4.21E-19
|
5.67E-20
|
|
-4.21E-19
|
0.858
|
199.3
|
103.5
|
|
1.003
|
-2.52E-19
|
-3.06E-19
|
5.41E-20
|
|
-3.60E-19
|
1.003
|
184.3
|
101.1
|
|
1.147
|
-1.85E-19
|
-2.55E-19
|
6.93E-20
|
|
-3.15E-19
|
1.147
|
172.5
|
114.4
|
|
1.2548
|
-1.85E-19
|
-2.64E-19
|
7.86E-20
|
|
-2.64E-19
|
1.2548
|
157.8
|
121.8
|
|
1.339
|
-1.85E-19
|
-2.67E-19
|
8.14E-20
|
|
-2.67E-19
|
1.339
|
158.6
|
123.9
|
|
1.407
|
-1.85E-19
|
-2.57E-19
|
7.14E-20
|
|
-2.57E-19
|
1.407
|
155.7
|
116.1
|
|
1.544
|
-1.42E-19
|
-2.10E-19
|
6.78E-20
|
|
-2.34E-19
|
1.544
|
148.6
|
113.2
|
|
1.668
|
-9.55E-20
|
-1.64E-19
|
6.86E-20
|
|
-2.17E-19
|
1.668
|
143.0
|
113.8
|
|
1.7411
|
-7.47E-20
|
-1.44E-19
|
6.89E-20
|
|
-2.08E-19
|
1.7411
|
140.1
|
114.0
|
|
1.8093
|
-6.21E-20
|
-1.31E-19
|
6.86E-20
|
|
-2.00E-19
|
1.8093
|
137.4
|
113.8
|
|
1.917
|
-5.13E-20
|
-1.21E-19
|
6.96E-20
|
|
-1.89E-19
|
1.917
|
133.6
|
114.7
|
|
2
|
-4.99E-20
|
-1.20E-19
|
6.99E-20
|
|
-1.81E-19
|
2
|
130.5
|
114.9
|
|
2.1064
|
-4.99E-20
|
-1.22E-19
|
7.23E-20
|
|
-1.72E-19
|
2.1064
|
127.3
|
116.8
|
|
2.205
|
-4.99E-20
|
-1.25E-19
|
7.56E-20
|
|
-1.64E-19
|
2.205
|
124.4
|
119.4
|
|
2.298
|
-4.99E-20
|
-1.28E-19
|
7.79E-20
|
|
-1.57E-19
|
2.298
|
121.9
|
121.2
|
|
2.5
|
-4.99E-20
|
-1.28E-19
|
7.80E-20
|
|
-1.44E-19
|
2.5
|
116.7
|
121.4
|
|
2.71
|
-4.99E-20
|
-1.22E-19
|
7.20E-20
|
|
-1.33E-19
|
2.71
|
112.1
|
116.6
|
|
2.875
|
-4.62E-20
|
-1.15E-19
|
6.83E-20
|
|
-1.26E-19
|
2.875
|
109.0
|
113.5
|
|
3.1
|
-3.30E-20
|
-9.95E-20
|
6.65E-20
|
|
-1.17E-19
|
3.1
|
104.9
|
112.0
|
|
3.472
|
-1.42E-22
|
-6.08E-20
|
6.07E-20
|
|
-1.04E-19
|
3.472
|
99.2
|
107.0
|
|
3.886
|
4.13E-20
|
-2.33E-20
|
6.46E-20
|
|
-9.31E-20
|
3.886
|
93.7
|
110.4
|
|
4.2
|
4.29E-20
|
-4.32E-20
|
8.60E-20
|
|
-8.61E-20
|
4.2
|
90.1
|
127.4
|
|
4.619
|
4.29E-20
|
-7.83E-20
|
1.21E-19
|
|
-7.83E-20
|
4.619
|
86.0
|
151.2
|
|
5.165
|
4.29E-20
|
-5.85E-20
|
1.01E-19
|
|
-7.00E-20
|
5.165
|
81.3
|
138.3
|
|
5.911
|
7.36E-20
|
-5.82E-20
|
1.32E-19
|
|
-6.13E-20
|
5.911
|
76.1
|
157.7
|
|
6.632
|
7.93E-20
|
-5.04E-20
|
1.30E-19
|
|
-5.45E-20
|
6.632
|
71.7
|
156.5
|
|
7.515
|
7.93E-20
|
-1.34E-20
|
9.28E-20
|
|
-4.81E-20
|
7.515
|
67.4
|
132.3
|
|
8.634
|
7.93E-20
|
-2.73E-21
|
8.21E-20
|
|
-4.19E-20
|
8.634
|
62.9
|
124.5
|
|
12.25
|
1.05E-19
|
4.02E-20
|
6.44E-20
|
|
-2.95E-20
|
12.25
|
52.8
|
110.2
|
|
14.87
|
1.05E-19
|
-6.60E-21
|
1.11E-19
|
|
-2.43E-20
|
14.87
|
47.9
|
144.9
|
|
17.57
|
1.05E-19
|
1.45E-20
|
9.01E-20
|
|
-2.06E-20
|
17.57
|
44.1
|
130.4
|
|
22.94
|
1.05E-19
|
-3.66E-21
|
1.08E-19
|
|
-1.58E-20
|
22.94
|
38.6
|
143.0
|
|
27.49
|
1.05E-19
|
3.11E-20
|
7.35E-20
|
|
-1.32E-20
|
27.49
|
35.2
|
117.8
|
|
34.68
|
1.09E-19
|
7.51E-20
|
3.39E-20
|
|
-1.04E-20
|
34.68
|
31.4
|
79.9
|
|
41.66
|
1.30E-19
|
1.11E-19
|
1.92E-20
|
|
-8.71E-21
|
41.66
|
28.7
|
60.2
|
|
44.866
|
1.30E-19
|
1.17E-19
|
1.36E-20
|
|
-8.06E-21
|
44.866
|
27.6
|
50.7
|
|
49.12
|
1.30E-19
|
1.24E-19
|
6.40E-21
|
|
-7.36E-21
|
49.12
|
26.4
|
34.8
|
|
50.75
|
1.32E-19
|
escape point
|
|
|
50.75
|
|
|
|
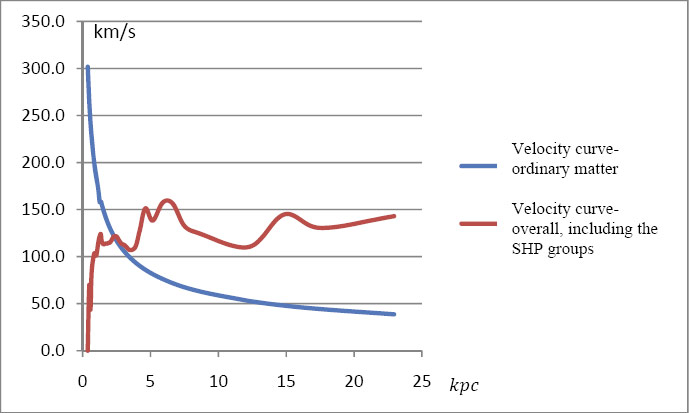
Figure
6-5a: The galaxy
rotation curve within the disk range of distances between  to
to  (
axis) and velocity between
(
axis) and velocity between  and
and  (on the
  axis).
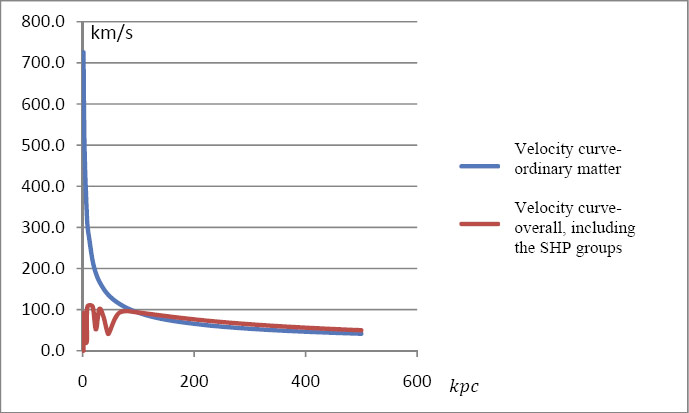
Figure
6-5b: The velocity
curve of a galaxy similar to the one provided by figure 6-5a, where  increases from
  to to .
The x
axis provides the distance from the galactic center between
and .
The x
axis provides the distance from the galactic center between
and  ,
and the y
axis provides the object velocity between
and ,
and the y
axis provides the object velocity between
and  . .
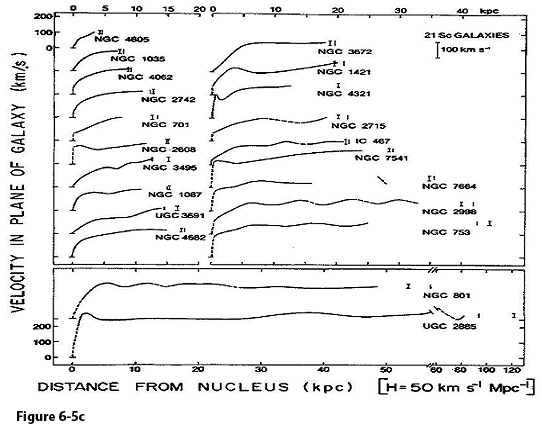
Figure
6-5c: Measured mean
velocities in the plane of the galaxy, as a function of linear
distance from the nucleus
for 21 Sc galaxies,
arranged according to increasing linear radius. The curve drawn is a
rotation curve formed from the mean of velocities on both sides of
major axis (Rubin, Ford & Thonard, 1980). The general trend is
of rapid velocity rise to  at about
  ,
and slower rise or close to constant velocity thereafter. ,
and slower rise or close to constant velocity thereafter.
Figure
6-5a provides the distance range between
 and
and
 .
Within the range of .
Within the range of
 ,
the UG rotation curve demonstrates an initial sharp increase in the
velocity of the test object from ,
the UG rotation curve demonstrates an initial sharp increase in the
velocity of the test object from
 to about
 .
At roughly .
At roughly
 to
to
 ,
the rotation curve levels and displays few oscillations within ,
the rotation curve levels and displays few oscillations within
 around an average velocity curve of about
 ,
yet overall remains level relative to the sharp decreasedemonstrated by the Newtonian rotation curve, which reduces
proportionally to ,
yet overall remains level relative to the sharp decreasedemonstrated by the Newtonian rotation curve, which reduces
proportionally to
 .
In addition, the approximately constant rotation curve increases
slightly with distance, in good agreement with observation, as shown
in figure 6-5c.10
As demonstrated by figure 6-4b, the rotational velocity is not
isotropic within the galaxy, and is dependent on the objects
azimuth. .
In addition, the approximately constant rotation curve increases
slightly with distance, in good agreement with observation, as shown
in figure 6-5c.10
As demonstrated by figure 6-4b, the rotational velocity is not
isotropic within the galaxy, and is dependent on the objects
azimuth.
A second example is provided in figures 6-5d and 6-5e for a galaxy
with similar parameters, containing
 of ordinary matter (rather than
 ).11
Due to the increased mass of the ordinary matter, the test particle
remains trapped within the galaxy even when its potential plus
kinetic energy is equal to its potential energy at the
maximum. As demonstrated, the encounter with a higher potential
energy maximum abruptly elevates the potential plus kinetic energy
level of the test particle. The particles potential plus
kinetic energy (indicated in black) remains almost constant at this
level, demonstrating only a slight increase due to the rotation of
the spiral, until the next encounter with a substantially higher
potential energy maximum. Similar calculations lead to the rotation
curve of the second galaxy displayed (for a given azimuth) in figures
6-5b. ).11
Due to the increased mass of the ordinary matter, the test particle
remains trapped within the galaxy even when its potential plus
kinetic energy is equal to its potential energy at the
maximum. As demonstrated, the encounter with a higher potential
energy maximum abruptly elevates the potential plus kinetic energy
level of the test particle. The particles potential plus
kinetic energy (indicated in black) remains almost constant at this
level, demonstrating only a slight increase due to the rotation of
the spiral, until the next encounter with a substantially higher
potential energy maximum. Similar calculations lead to the rotation
curve of the second galaxy displayed (for a given azimuth) in figures
6-5b.
There are a large number of possible combinations of SHP and ordinary
matter parameters. The rotation curves of spiral galaxies therefore
do not conform to a universal form, and different combinations may
result in a different rotational curve. However, at distances
 ,
where the central rotating spiral is sufficiently strong relative to
the influence of the gravitational field of the galactic ordinary
matter, the velocity curve of the galaxy will remain flat relative to
the Newtonian velocity curve. ,
where the central rotating spiral is sufficiently strong relative to
the influence of the gravitational field of the galactic ordinary
matter, the velocity curve of the galaxy will remain flat relative to
the Newtonian velocity curve.
In summary, the UG theory is demonstrated to provide a constant
velocity curve in spiral galaxies that is consistent with
observations, without the need to assume the presence of yet
undetected dark matter.
Section
VI-4: The Influence of SHP Group Rotation on Star Formation in
Galaxies
Observations demonstrate that new star formation is relatively low in
elliptical galaxies, where the amount of interstellar gas is scarce,
while a substantial amount of star formation takes place within
gas-rich spiral galaxies. According to current theory, star
formation occurs when a large cloud of gas exceeds a critical limit,
such as the Jeans limit for an isolated cloud or the Bonnor-Ebert
mass when the cloud is subjected to external pressure. It is
well-understood that when the Brownian pressure created by the gas
particles can no longer balance the gravitational force, the cloud
will subsequently collapse toward its center to create a star.
However, it is not yet well-understood what causes the observed
fragmentation that enables stars to form in groups ranging from
binary systems to stellar clusters containing hundreds of thousands
of members, or what stops this fragmentation. In addition, the
mechanisms that determine the mass and quantity of newly formed star
systems are currently unknown. In section IV-1-2 of Chapter IV,
galactic star formation via the interaction of binary SHP groups was
discussed for the case of static or nearly static SHP groups, where
as shown in figures 4-2a to 4-2e, the intersections of the minimum
contours of two SHP groups create a local web of potential energy
minima at which clouds of gas are formed. The collapses of these
clouds become sites of star formation. It was further demonstrated
that the number of intersections per volume of space increases as
their distance from the nearest SHP group is reduced. In addition,
the amount of matter at each intersection was shown to decrease at
close proximity to a superheavy particle group, suggesting that the
number of stars produced is inversely related to their size and mass.
Finally, it was concluded that as the galaxy center is relatively
far from both SHP groups (by as much as
 in the given examples), the stars produced at the intersection points
within a given volume of space located near the galactic center are
expected to be fewer in number and larger in size and mass than those
produced in an equal volume of space located closer to either one of
the SHP groups near the tips of the galactic bar.12
in the given examples), the stars produced at the intersection points
within a given volume of space located near the galactic center are
expected to be fewer in number and larger in size and mass than those
produced in an equal volume of space located closer to either one of
the SHP groups near the tips of the galactic bar.12
Rapid SHP rotation may have the effect of converting star formation
from a one-time event, by which thousands to hundreds of thousands of
stars are formed at static minimum points, into a production line
which over time creates more than
 stars. In the case of SHP rotation, at distances of
 ,
orbiting matter can rotate at the same angular velocity as the
rotating central core and its SHP groups, and can therefore keep pace
with the rotating pattern. Hence, as in the static SHP scenario, at
these short distances the stars remain confined to their place of
birth within the galaxy. Consequently, the number of stars is
limited by the number of minima intersections. However, as the SHP
groups rotate around the galaxy center, at distances
their zonal pattern rotates too fast for the newly generated stars to
keep up, and the new stars begin to lag behind. As the zonal pattern
continues to rotate, leaving behind the newly formed stars, its
minima are shifted to nearby locations containing fresh interstellar
gas. The accretion of matter at the new minima locations initiates a
series of additional collapses, and a new set of stars is generated.
This process is repeated with rotation, and by the time that the SHP
groups have completed a full orbit around the galactic center,
returning to their original positions, the stars created previously
at these minima locations are expected to have relocated and to have
been replaced with fresh interstellar gas, allowing the process to
repeat all over again. The mechanism underlying the migration of
stars away from their place of birth is as follows: As the minima of
the pattern rotate away from the stars formed within them, the minima
are replaced by their adjacent maxima contours. As these maxima
cross paths with the slower moving stars, they elevate the overall
potential plus kinetic energy of the stellar systems to match or
slightly exceed their potential energy at the maxima. As the pattern
continues to rotate faster than the orbiting new stars, the maxima
contours move away from the stars initial areas of formation,
thus converting their elevated potential energy into kinetic energy,
thereby accelerating them away from their original positions. ,
orbiting matter can rotate at the same angular velocity as the
rotating central core and its SHP groups, and can therefore keep pace
with the rotating pattern. Hence, as in the static SHP scenario, at
these short distances the stars remain confined to their place of
birth within the galaxy. Consequently, the number of stars is
limited by the number of minima intersections. However, as the SHP
groups rotate around the galaxy center, at distances
their zonal pattern rotates too fast for the newly generated stars to
keep up, and the new stars begin to lag behind. As the zonal pattern
continues to rotate, leaving behind the newly formed stars, its
minima are shifted to nearby locations containing fresh interstellar
gas. The accretion of matter at the new minima locations initiates a
series of additional collapses, and a new set of stars is generated.
This process is repeated with rotation, and by the time that the SHP
groups have completed a full orbit around the galactic center,
returning to their original positions, the stars created previously
at these minima locations are expected to have relocated and to have
been replaced with fresh interstellar gas, allowing the process to
repeat all over again. The mechanism underlying the migration of
stars away from their place of birth is as follows: As the minima of
the pattern rotate away from the stars formed within them, the minima
are replaced by their adjacent maxima contours. As these maxima
cross paths with the slower moving stars, they elevate the overall
potential plus kinetic energy of the stellar systems to match or
slightly exceed their potential energy at the maxima. As the pattern
continues to rotate faster than the orbiting new stars, the maxima
contours move away from the stars initial areas of formation,
thus converting their elevated potential energy into kinetic energy,
thereby accelerating them away from their original positions.
Consequently, by the time the following minimum arrives at a given
location of star formation, the stars produced in the previous cycles
have moved away from their original coordinates, vacating the area
for an inflow of fresh interstellar gas, ready to collapse into new
stars. This process may continue for as long as a new supply of
interstellar gas and dust is available. As will be shown in Chapter
VII, a constant supply of interstellar matter is expected to be
available until the superheavy particles generated at the galactic
core become sufficiently massive to lock the galaxy, or
to severely restrict any further inflow of ordinary matter.
Figures
6-6, 6-7 and 6-8 provide the potential energy of a test object in a
galaxy using equation 4-1-1a with the set of parameters
 ,
, ,
,
 , ,
 ,
,
and
. ,
,
and
.
Figure
6-6a: Provides the
potential energy of an ordinary particle of mass
along the x
axis (which passes through the binary SHP
groups of a galaxy) is described by the parameters ,
,
,,,
and  of equation 4-1-1a. A
high density of minima is demonstrated to occur between approximately
of equation 4-1-1a. A
high density of minima is demonstrated to occur between approximately
 ,
at which a large number of small stars
are expected to be produced. In areas with a low density of minima,
as observed deep in the galaxy center at ,
at which a large number of small stars
are expected to be produced. In areas with a low density of minima,
as observed deep in the galaxy center at  ,
or at ,
or at  ,
the amount of matter collapsing toward the minima is greater,
resulting in the creation of larger, but fewer stars
per volume of space. At distances ,
the amount of matter collapsing toward the minima is greater,
resulting in the creation of larger, but fewer stars
per volume of space. At distances  ,
minima and maxima cease to exist, allowing matter to collapse into a
possible black hole. ,
minima and maxima cease to exist, allowing matter to collapse into a
possible black hole.
Figure
6-6b: Displays the
same galaxy at a later time, where the rotated
axis becomes aligned perpendicular to the line connecting the two
SHP
groups. As the
axis is located relatively far from the two SHP
groups (the closest points are  away from either SHP
group), the number of minima per volume of space along the
axis decreases, resulting in the production of fewer, yet more
massive stars within the
range of
away from either SHP
group), the number of minima per volume of space along the
axis decreases, resulting in the production of fewer, yet more
massive stars within the
range of  At this orientation, when confined to the
axis, maxima and minima cease to exist below about
At this orientation, when confined to the
axis, maxima and minima cease to exist below about  . .
Figure
6-6a provides the potential energy of the object when the
axis is aligned with the two SHP groups positioned at
 (or at about
 to
to
 from the plotted horizontal axis of figure 6-7). As the displayed
axis passes through the two SHP groups, the figure displays a high
density of minima between approximately
from the plotted horizontal axis of figure 6-7). As the displayed
axis passes through the two SHP groups, the figure displays a high
density of minima between approximately
 ,
where a large number of relatively small stars are expected to be
produced. In areas with a low density of minima, as observed deep in
the galaxy center at ,
where a large number of relatively small stars are expected to be
produced. In areas with a low density of minima, as observed deep in
the galaxy center at
 ,
or at ,
or at
 ,
the amount of matter collapsing toward each minimum is relatively
greater, resulting in the creation of larger, yet fewer stars per
volume of space. Figure 6-6b displays the same hypothetical galaxy
at a later time, where the rotated
axis becomes aligned perpendicular to the line connecting the two
SHP groups. As the distance between the
axis and the two SHP groups increases (the closest points are
away from either SHP group), the number of minima per volume of space
along the
axis is reduced. Closer to the center of the galaxy, at ,
the amount of matter collapsing toward each minimum is relatively
greater, resulting in the creation of larger, yet fewer stars per
volume of space. Figure 6-6b displays the same hypothetical galaxy
at a later time, where the rotated
axis becomes aligned perpendicular to the line connecting the two
SHP groups. As the distance between the
axis and the two SHP groups increases (the closest points are
away from either SHP group), the number of minima per volume of space
along the
axis is reduced. Closer to the center of the galaxy, at
 ,13
the slope of the potential energy due to the contribution of ordinary
matter in the galactic core becomes greater than the contribution of
the SHP group, and the oscillation maxima and minima appear washed
out.14
Consequently, the matter below roughly ,13
the slope of the potential energy due to the contribution of ordinary
matter in the galactic core becomes greater than the contribution of
the SHP group, and the oscillation maxima and minima appear washed
out.14
Consequently, the matter below roughly
 can collapse toward the center of the galaxy, where no fragmentation
can occur, and the spiral cannot reach this area. In this model the
spiral begins at approximately
can collapse toward the center of the galaxy, where no fragmentation
can occur, and the spiral cannot reach this area. In this model the
spiral begins at approximately
 ,
thus matter below this distance cannot be carried outwards by the
spiral. The same observations become clear in the two dimensional
maps of the same galaxy provided in figures 6-7, 6-8 and 6-9, where
the brighter colors denote lower potential energy of the test object.
The SHP groups located within the area indicated by the white arcs15
are located near the tips of the bar and create an interference
pattern of bright (minima) and dark (maxima) regions. As the SHP
groups and their resultant zonal patterns rotate, matter in the
vicinity of the maxima gravitate toward their nearest minimum,
creating sufficiently high concentrations of matter to trigger a
collapse in each of the minima. The size of a minimum, and to some
extent its location, determine the amount of matter that may be
enclosed in its vicinity, and therefore the size and the mass of the
resultant star. ,
thus matter below this distance cannot be carried outwards by the
spiral. The same observations become clear in the two dimensional
maps of the same galaxy provided in figures 6-7, 6-8 and 6-9, where
the brighter colors denote lower potential energy of the test object.
The SHP groups located within the area indicated by the white arcs15
are located near the tips of the bar and create an interference
pattern of bright (minima) and dark (maxima) regions. As the SHP
groups and their resultant zonal patterns rotate, matter in the
vicinity of the maxima gravitate toward their nearest minimum,
creating sufficiently high concentrations of matter to trigger a
collapse in each of the minima. The size of a minimum, and to some
extent its location, determine the amount of matter that may be
enclosed in its vicinity, and therefore the size and the mass of the
resultant star.
In order to obtain a more detailed analysis of the distribution of
stars deep inside the galactic bulge, the mass of the ordinary matter
was reduced to
 (approximately 3,000,000 times the mass of the Sun). The resultant
figures 6-9a to 6-9c provide two dimensional maps of the galaxy
center with the following parameters
,
,
,
,
,
and
(approximately 3,000,000 times the mass of the Sun). The resultant
figures 6-9a to 6-9c provide two dimensional maps of the galaxy
center with the following parameters
,
,
,
,
,
and
 ,
viewed in different resolutions at various locations within the
center of the galactic disk. ,
viewed in different resolutions at various locations within the
center of the galactic disk.
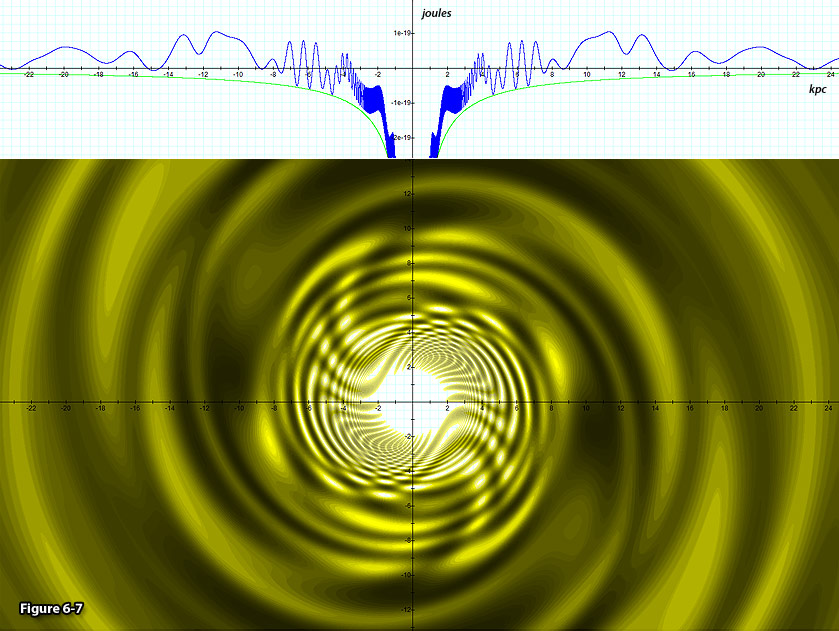
Figure
6-7: Depicts a two
dimensional contour map of the same galaxy provided in figures 6-6a
and 6-6b, where the brighter colors
denote lower potential energy of the test object.
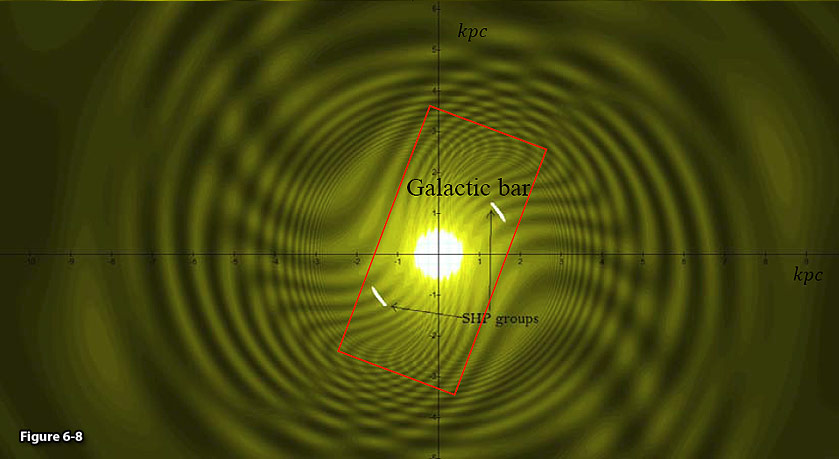
Figure
6-8: The same galaxy
displayed in figure 6-7 is shown in higher resolution, where the
locations of the SHP
groups are indicated in white and the approximate area of the
galactic bar is indicated
in red. Note that a majority of the stars
are produced in the general area of the tips of the bar,
as the immediate areas surrounding the SHP
groups are fragmented into many isolated clouds that may be too small
to collapse.
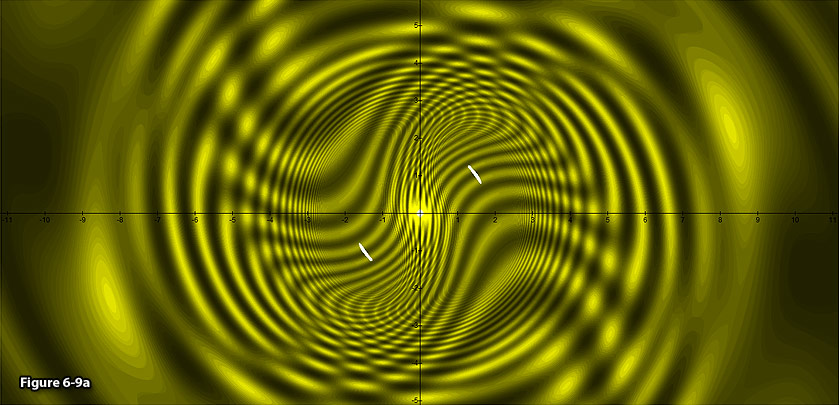
Figure
6-9a:Displays
a two dimensional contour map of a similar galaxy with a reduced mass
of ordinary matter, using the parameters ,
,
,,
and  .
Brighter colors denote
lower potential energy of the test object. As can be seen, the SHP
groups located within the
area indicated by the bright arcs and are located near the tips of
the bar and create an
interference pattern of bright (minima) and dark
(maxima) elliptical or arc
regions. As the SHP
groups and their resultant
zonal patterns rotate, matter accumulates in the vicinity of the
minima, thereby creating dense molecular clouds
that collapse and create stars.
Filaments occur in the long bright arcs near the central bulge.
Note the pattern of a bar
within a wider set of rings at the center of the figure. .
Brighter colors denote
lower potential energy of the test object. As can be seen, the SHP
groups located within the
area indicated by the bright arcs and are located near the tips of
the bar and create an
interference pattern of bright (minima) and dark
(maxima) elliptical or arc
regions. As the SHP
groups and their resultant
zonal patterns rotate, matter accumulates in the vicinity of the
minima, thereby creating dense molecular clouds
that collapse and create stars.
Filaments occur in the long bright arcs near the central bulge.
Note the pattern of a bar
within a wider set of rings at the center of the figure.
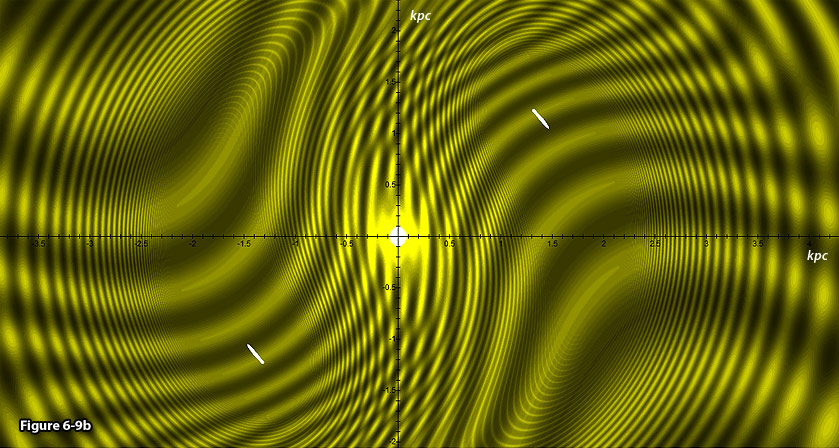 
Figure
6-9b: Provides the
same galaxy as figure 6-9a displayed in a higher spatial resolution.
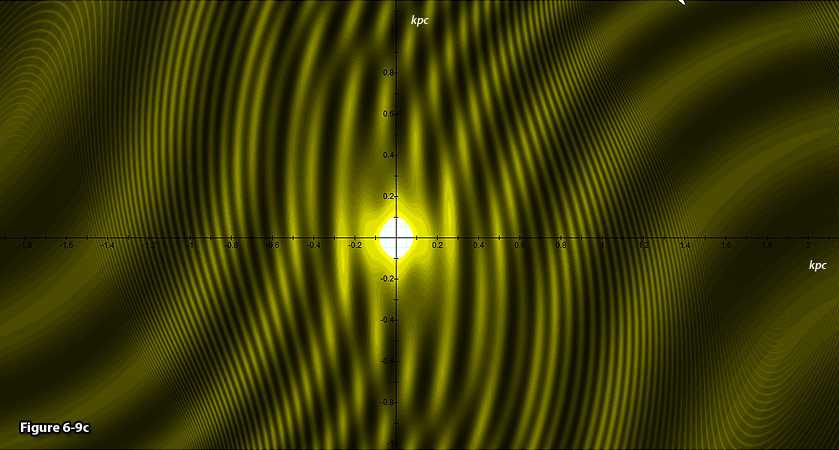
Figure 6-9c: Further
increasing the resolution to concentrate on the central bulge
displays a central bright area containing the rotating core of the
galaxy (which may possibly be a black hole). The increase in the
size of the stars as they approach the central
core is apparent.
As aforementioned,
with the exception of the region surrounding the central core at
 ,
the minima are contained within the brightest areas of the figure.
The geometry of the bright areas can be divided into elliptical
regions, circular regions and arcs. The arc formations bear a strong
resemblance to the patterns of observed filaments. All three
geometrical patterns indicate regions that may either collapse into a
star or produce dense molecular clouds or nebulae. The mass of a
star can be expected to grow with the size of the area enclosed
within the vicinity of its potential energy minimum. A filament is
likely to be created in areas containing long continuous bright
arcs.16
As previously discussed, the bright segments, or arcs, reduce in
size and increase in number with increasing proximity to either one
of the SHP groups. The existence of long arc regions may explain
phenomena such as the filaments observed within galaxies and
nebulae, as well as molecular clouds. Note that certain parallel
sets of (bright) filaments resemble the structure of the Pillars of
Creation of the Orion Nebula shown in figure 6-10. Also worth
mentioning is the approximately circular string of about 6 to 8 large
stars produced at distances of about ,
the minima are contained within the brightest areas of the figure.
The geometry of the bright areas can be divided into elliptical
regions, circular regions and arcs. The arc formations bear a strong
resemblance to the patterns of observed filaments. All three
geometrical patterns indicate regions that may either collapse into a
star or produce dense molecular clouds or nebulae. The mass of a
star can be expected to grow with the size of the area enclosed
within the vicinity of its potential energy minimum. A filament is
likely to be created in areas containing long continuous bright
arcs.16
As previously discussed, the bright segments, or arcs, reduce in
size and increase in number with increasing proximity to either one
of the SHP groups. The existence of long arc regions may explain
phenomena such as the filaments observed within galaxies and
nebulae, as well as molecular clouds. Note that certain parallel
sets of (bright) filaments resemble the structure of the Pillars of
Creation of the Orion Nebula shown in figure 6-10. Also worth
mentioning is the approximately circular string of about 6 to 8 large
stars produced at distances of about
 to
to
 from the center of the galaxy.
In general,three types of rings are often observed in barred galaxies:
nuclear rings, with radii of about
 ,
elliptical inner rings of few kiloparsecs in diameter, which align
and connect with the central bar, and outer rings, with radii of
approximately 1.7 to 2.2 times the radius of the inner ring. It has
been suggested to identify the nuclear rings with the inner Lindblad
resonance, the outer rings with the outer Lindblad resonance, and the
inner rings with either the corotation resonance or with higher
orders of the inner Lindblad resonances. However, observational data
has not yet confirmed these claims. Note that figures 6-7, 6-8, and
6-9a to 6-9c provide rings that fit beautifully with these
observations. However, in the calculated images, each of the three
classes of rings includes several nearly concentric rings at very
close proximity to each other. ,
elliptical inner rings of few kiloparsecs in diameter, which align
and connect with the central bar, and outer rings, with radii of
approximately 1.7 to 2.2 times the radius of the inner ring. It has
been suggested to identify the nuclear rings with the inner Lindblad
resonance, the outer rings with the outer Lindblad resonance, and the
inner rings with either the corotation resonance or with higher
orders of the inner Lindblad resonances. However, observational data
has not yet confirmed these claims. Note that figures 6-7, 6-8, and
6-9a to 6-9c provide rings that fit beautifully with these
observations. However, in the calculated images, each of the three
classes of rings includes several nearly concentric rings at very
close proximity to each other.
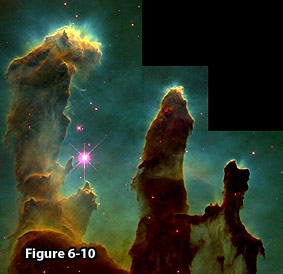
Figure
6-10: Pillars
of Creation
in the Eagle Nebula.
Image credit: ESA/NASA;
http://hubblesite.org/gallery/album/pr1995044a.
Interestingly, looking further into the center of the modeled galaxy,
figure 6-11a provides a calculated image that resembles
characteristics demonstrated by the central region of the Milky Way,
provided in figure 6-11b, where Sagittarius A is likely to be the
central rotating core.
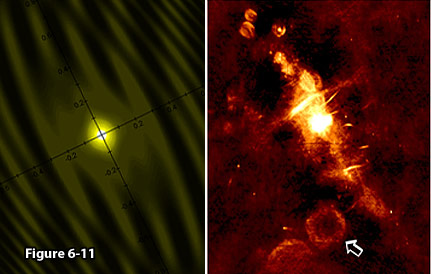
Figure
6-11:Zooming
further into the center of the model galaxy (calculated in figure
6-11a) provides an image that resembles the characteristic
demonstrated by the radio image of the central region of the Milky
Way Galaxy depicted in
figure 6-11b. The
circular structure on the bottom of the right image may possibly
indicate either a supernova remnant, or a ring around a superheavy
particle group in orbit around Sagittarius
A. Image
credit for figure 6-11b: N.E. Kassim et al., Naval Research
Laboratory, NRAO/AUI/NSF; http://www.nrao.edu/pr/2005/newsource/.
1
This results from the assumption that the object does not rotate in
the opposite direction of the spiral. In the case where the object
and the spiral rotate in opposing directions, the spiral will
initially slow down and halt the objects rotation, before
accelerating it in the opposite direction. From that point on, the
energy of the object will begin to increase. 2 indicates that the vast majority of the galaxys ordinary
matter is contained within its core and within the galactic disk.
indicates that the vast majority of the galaxys ordinary
matter is contained within its core and within the galactic disk. 3
The remaining  of the missing mass is
believed, according to the current leading paradigm, to consist of
dark energy.
of the missing mass is
believed, according to the current leading paradigm, to consist of
dark energy. 4
The leading alternative theory of Modified Newtonian Dynamics, or
MOND, is provided by
Milgrom, M. 1983.
ApJ.,
270, 371;
Milgrom, M, Braun, E. 1988.
ApJ.,
334, 130;
McGaugh, S.S. and Blok, W.J.G. de. 1998.
ApJ.,
499, 66;
Blok W.J.G de, McGaugh, S.S. 1998.
ApJ.
508, 132;Begeman, K.G, Broeils, A.H., and
Sanders, R.H. 1991.
MNRAS,
249, 523;
Sanders, R.H. 1996.
ApJ.,
473, 117;
and Sanders, R.H., Verheijen M.A.W. 1998.
ApJ.,
503, 97.
Non-gravitational acceleration of halo
gas rotation (due to magneto-hydrodynamical force) was also
suggested as an alternative by Nelson, A.H. 1988.
MNRAS.
233, 115. 5The dependency of  on
on  can be derived by assuming a homogenous spherical distribution of
  for
for  ,
and ,
and  for for  ,
where the density of the
ordinary matter ρ
is assumed to be constant. ,
where the density of the
ordinary matter ρ
is assumed to be constant. 6
Note that this discussion assumes that the effect exerted on the
given object by other orbiting objects is relatively small. As will
be shown in Chapter VII, this assumption does not necessarily hold
true for the case of elliptical galaxies.
7 Note that when a series of
graphs separated by a short time interval were calculated and
displayed in rapid succession as a movie, the waves of figures 6-4a
and 6-4b traveled outward, while the two dimensional map rotated
counterclockwise, displaying spirals that converge outward. 8 The slight positive slope is a
consequence of the small increase in the object energy due to the
work done by the spiral rotation. 9 Note that as demonstrated by
figure 6-4c, the potential energy is not rotationally symmetric, and
may vary with the azimuth. Therefore, the velocity curve may also
vary with the azimuth, in agreement with observations. 10 Note that a choice of  ,
rather than ,
rather than  ,
would have resulted in the maximum velocity of about ,
would have resulted in the maximum velocity of about  ,
which is closer to the range of velocities demonstrated by
Andromeda. Also note
that according to table 6-1, the velocity curve between
and about
is reduced significantly. However,while the theoretical
velocity curve demonstrates a rapid decline at ,
which is closer to the range of velocities demonstrated by
Andromeda. Also note
that according to table 6-1, the velocity curve between
and about
is reduced significantly. However,while the theoretical
velocity curve demonstrates a rapid decline at  (for this example), the density of matter within this range of
distances reduces significantly beyond the
minimum at about .
Therefore, beyond the distance of ,
the velocity curve begins
to decline towards the outermost maximum, where its
velocity nearly reduces to the Newtonian velocity. At this point,
the object escapes the galactic disk.
As the minima within the range of distances between
(for this example), the density of matter within this range of
distances reduces significantly beyond the
minimum at about .
Therefore, beyond the distance of ,
the velocity curve begins
to decline towards the outermost maximum, where its
velocity nearly reduces to the Newtonian velocity. At this point,
the object escapes the galactic disk.
As the minima within the range of distances between  and and are shallow and relatively far from each other, the velocity curve
in this distance range is less detectable. However, the constant
rotation curves of some
spiral galaxies were
observed to end with a detectable sharp reduction in velocity, as
demonstrated in the case of the velocity curves of NGC 2885 and NGC
7664 displayed in figure 6-5c.
are shallow and relatively far from each other, the velocity curve
in this distance range is less detectable. However, the constant
rotation curves of some
spiral galaxies were
observed to end with a detectable sharp reduction in velocity, as
demonstrated in the case of the velocity curves of NGC 2885 and NGC
7664 displayed in figure 6-5c. 11
As this example uses ,
the overall mass of the galaxys ordinary matter is  . . 12
In accordance with the UG stellar model, in 2008 Yusef-Zadeh and
colleagues announced evidence of very young stars
in a ring of gas near the heart of the Milky Way Galaxy.
The researchers observed strong radio emissions from natural
molecular masers, which form within dense collapsing clouds. The
presence of these masers suggests that gas is collapsing to form
protostars, which will
eventually form into stars
that are tens of times heavier than the Sun. In addition, these
protostars share the same space with older stars
(see Courtland, Rachel (July 23, 2008). Stellar Nursery Found
Near Milky Ways Violent Heart. New
Scientist,
http://www.newscientist.com/article/dn14390). Some stars
were observed further in toward the galaxy center, only two light
years away from Sagittarius A, currently believed to be a massive
black hole. Sagittarius A is thus a likely candidate to be the
rotating central core of
the galaxy. 13
The parameter  denotes the radius of the central core,
where the vast majority of the collapsed ordinary matter resides.
denotes the radius of the central core,
where the vast majority of the collapsed ordinary matter resides. 14
Note that if one of the SHP
groups was located at the center of the galaxy,  ,
its maxima and minima would either disappear everywhere, or would
exist anywhere, as long as ,
its maxima and minima would either disappear everywhere, or would
exist anywhere, as long as  .
However, since both of the SHP
groups are located at a distance .
However, since both of the SHP
groups are located at a distance  from the center, their maxima and minima may be diminished close to
the galactic center relative to the influence of the ordinary
matter.
from the center, their maxima and minima may be diminished close to
the galactic center relative to the influence of the ordinary
matter. 15
These areas appear white since the spatial oscillations became
extremely dense to the point of overwhelming the display resolution,
and were simply averaged out by the graphical program used. 16 Note that while some
of the segments displayed in the figures form genuine arcs, some of
the longer, apparently continuous bright areas in the vicinity of
the SHP groups are not
actually continuous, but instead contain large numbers of distinct
circular regions and arcs that are too small to appear separated.
Zooming the display can help distinguish between the two
possibilities (for example, compare figures 6-7, 6-8, 6-9a, 6-9b and
6-9c).
|