Click on the images to go to the chapter text
Saturn D Rings
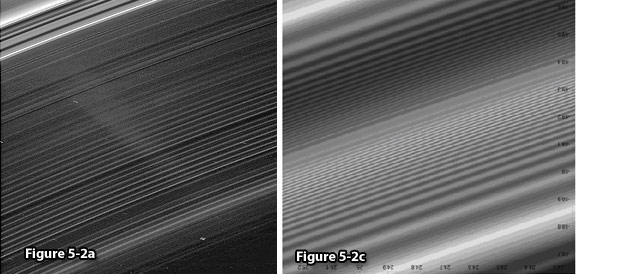
Figure 5-2a: Image obtained from NASA/JPL/Space Science Institute. http://photojournal.jpl.nasa.gov/catalog/?IDNumber=PIA08990
Figure 5-2c: Calculated using 
Saturn B rings and
Cassini Division
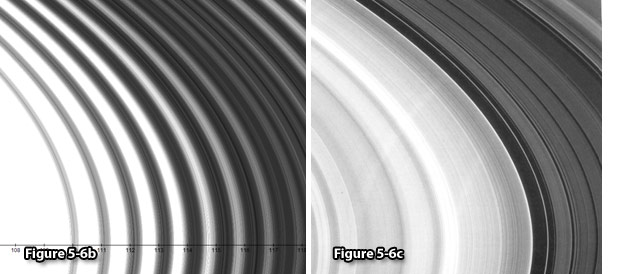
Figure 5-6b: UG Calculated B ring section.
Figure 5-6c: Outer B ring, image credit: NASA/JPL/Space Science Institute; http://photojournal.jpl.nasa.gov/catalogue/PIAA06535
Saturn A Ring
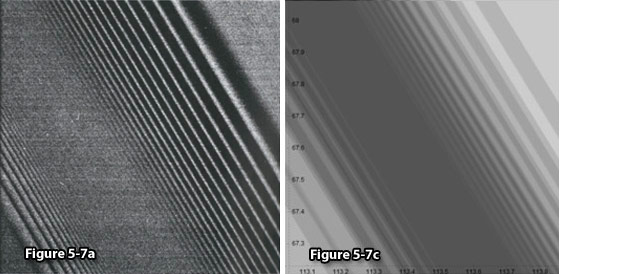
Figure 5-7a: Spiral bending waves (right) and density waves in Saturns A ring interior to the Encke Gap.
Image credit: NASA/JPL/Space Science Institute; http://photojournal.jpl.nasa.gov/catalogue/PIA06093.
Figure 5-7c: Calculated using 
Saturn Main Rings
5-1b:
UG
calculated image of Saturns
main rings.
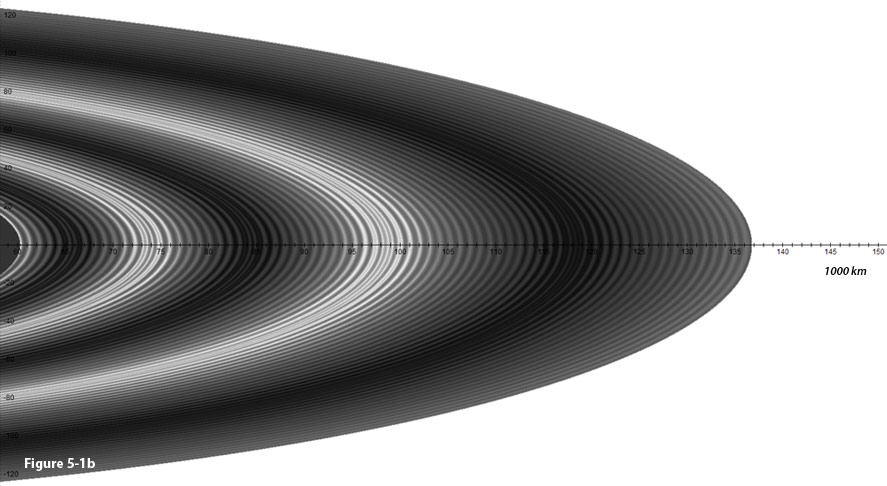
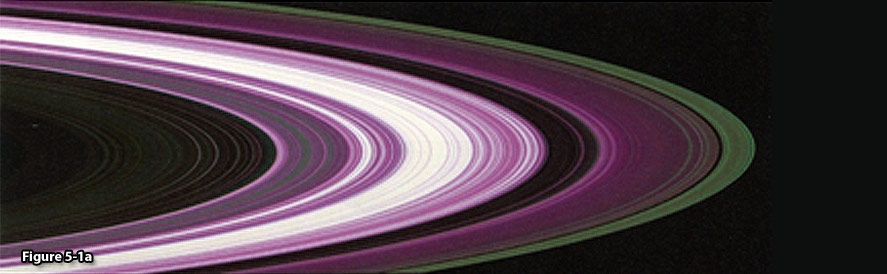
Figures
5-1a and 5-1b:Displays a
comparison between the UG calculated zones providing rings D,C,B, A
and the Cassini Division
(figure 5-1b) and Saturns
observed ring profile (figure 5-1a). In figure 5-1a areas depicted
in green and blue are dominated by small particles, and areas
indicated in violet consist mainly of large particles. White areas
indicate regions that were so opaque that the size of particle
could not be determined. Image
credit for figure 5-1a: NASA/JPL;
http://photojournal.jpl.nasa.gov/catalogue/PIA07872.
|