Click on the images to go to the chapter text
Hourglass Nebula
MyCn
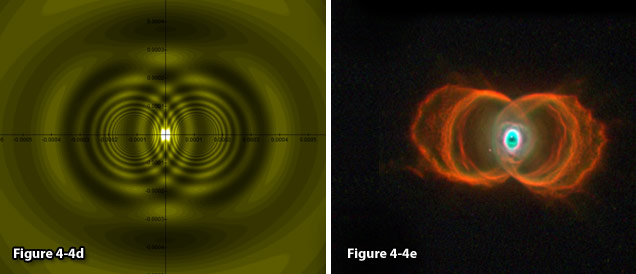
Figure
4-4d:
Demonstrates a calculated hourglass morphology
generated by two stationary single-particle SHP
groups of SHP
mass  ,
where the SHP
velocity ,
where the SHP
velocity  ,
the distance between the SHP
groups and
their common center of mass ,
the distance between the SHP
groups and
their common center of mass  ,
and the overall mass of ordinary matter ,
and the overall mass of ordinary matter  .
The calculated pattern bears a significant resemblance to the center
of the Hourglass
nebula
MyCn 18displayed
in figure 4-4e. .
The calculated pattern bears a significant resemblance to the center
of the Hourglass
nebula
MyCn 18displayed
in figure 4-4e. Figure
4-4e: The Hourglass
Nebula, MyCn 18. Image
credit: R. Sahai and J.
Trauger, Photo AURA/STScl/NASA/JPL
(NASA photo # STScl-PRC96-07);
http://apod.nasa.gov/apod/ap020615.html.
Andromeda M32 Galaxy Center
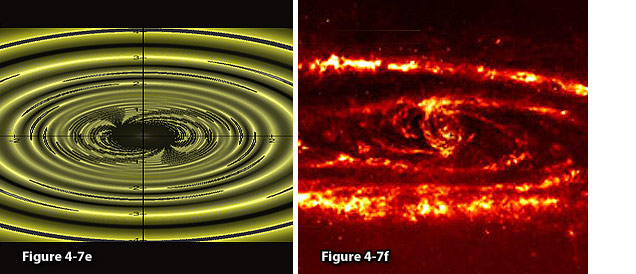
Figure 4-7e:
Provides the
tilted version of the calculated image of the center of the
Andromeda galaxy.
Note the ansae and two
spiral arms displayed at
the central bulge and the
similarities between the calculated image in figure 4-7e and the
observed center of Andromeda in figure 4-7f. Figure
4-7f: A view of the
center of figure 4-7c.
NGC-4622 Galaxy 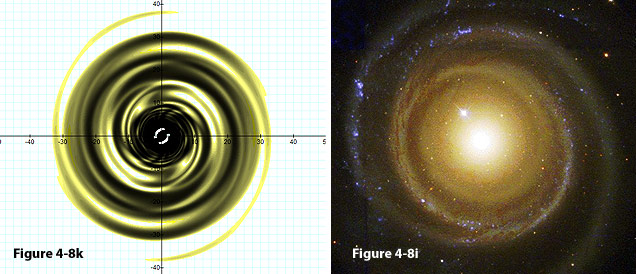
Figures
4-8h and 4-8i:
Comparison of the calculated galaxy to
NGC-4622 using  , ,
 , ,
 , ,
 , ,
 , ,
 , , ,
and ,
and  .
Credit for Figure 4-8i:G. Byrd, R. Buta,
(Univ.Alabama,
Tuscaloosa), T. Freeman (Bevill
State College),
NASA;
http://apod.nasa.gov/apod/ap040221.html. .
Credit for Figure 4-8i:G. Byrd, R. Buta,
(Univ.Alabama,
Tuscaloosa), T. Freeman (Bevill
State College),
NASA;
http://apod.nasa.gov/apod/ap040221.html.
NGC 488 Galaxy
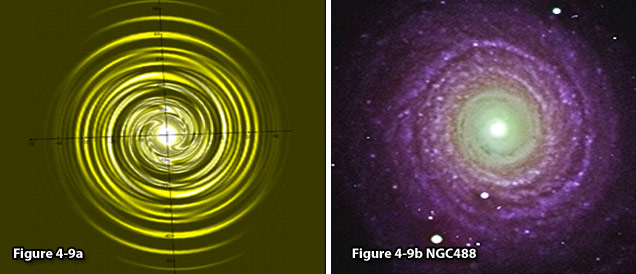
Figures
4-9a and 4-9b: Comparison between
a tilted view of the calculated galaxy and NGC
488,
using the same
parameters ,
,
,
 ,
, ,
,
 ,
and an increased speed of ,
and an increased speed of  .
The rotational direction of the SHP
groups was reversed to clockwise.24 .
The rotational direction of the SHP
groups was reversed to clockwise.24 Figure
4-9b: NGC
488,
image credit:
Johan Knapen and Nik Szymanek, Isaac Newton
group of telescopes. http://www.ing.iac.es/PR/science/ngc488.html.
The Red Square and Red Rectangle
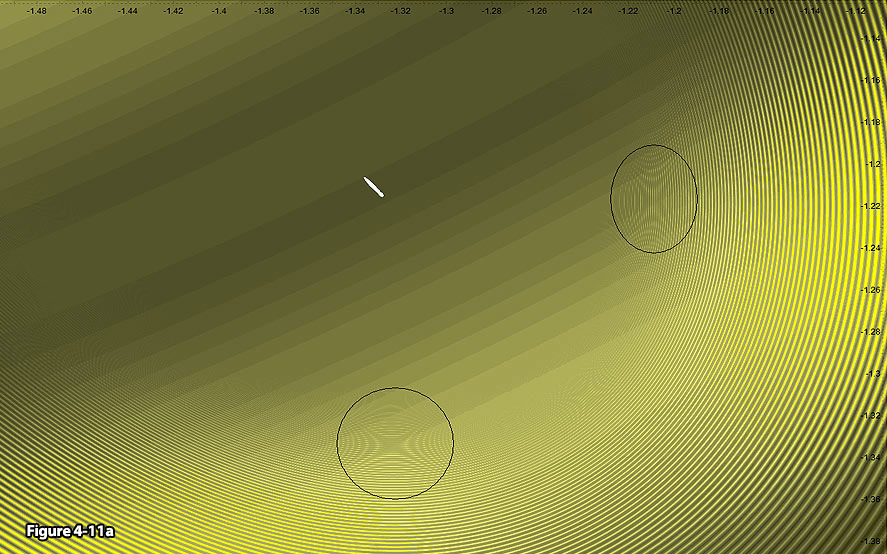
Figure
4-11a: Provides a
high resolution image of the same galaxy modeled in figure 4-8h,
using ,
 ,
,
, ,
,
,
 ,
and ,
and .
The display is zoomed
to about .
The display is zoomed
to about  around one of the SHP
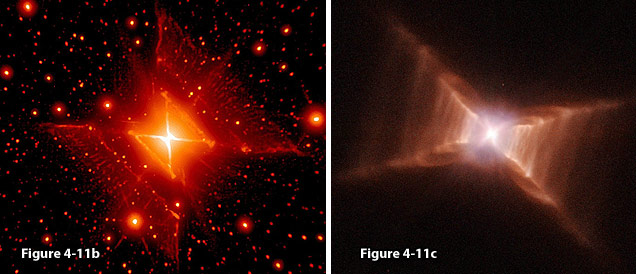
groups. The circled areas
bear a striking resemblance to MCW 922, the Red Square
Nebula, and to the Red Rectangle
shown in figures 4-11b and 4-11c respectively (note that aside from
the two circled patterns, there are few more similar unmarked
patterns). Note that for the purpose of clarity, the color scheme is
reversed, where the darker color values indicate lower potential
energy.
around one of the SHP
groups. The circled areas
bear a striking resemblance to MCW 922, the Red Square
Nebula, and to the Red Rectangle
shown in figures 4-11b and 4-11c respectively (note that aside from
the two circled patterns, there are few more similar unmarked
patterns). Note that for the purpose of clarity, the color scheme is
reversed, where the darker color values indicate lower potential
energy. Figure
4-11b:MWC
922: The Red Square
Nebula credit(Tuthill
& Lloyd, 2007);
http://apod.nasa.gov/apod/ap070416.html. Figure
4-11c: The Red
Rectangle, Image credit:
H. Van Winckel (KULeuven),
M. Cohen (UC Berkely), H. Bond (STScI), T. Gull (GSFC), ESA, NASA;
http://www.nasaimages.org/luna/servlet/detail/NVA2~4~4~5326~105852:
Rungs-of-the-Red-Rectangle.
Cartwheel Galaxy ESO 350-40; Supernova 1987A morphologies
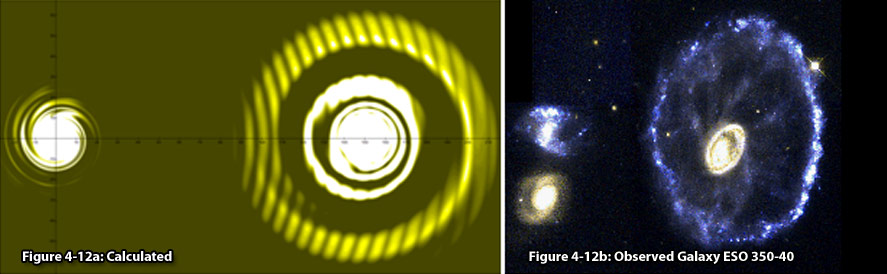
Figure
4-12a: UG calculated
image
Figure
4-12b: Observed
Cartwheel Galaxy ESO
350-40,
image credit: NASA, ESA,
and K. Borne (STScI)http://hubblesite.org/gallery/album/pr2007017d.
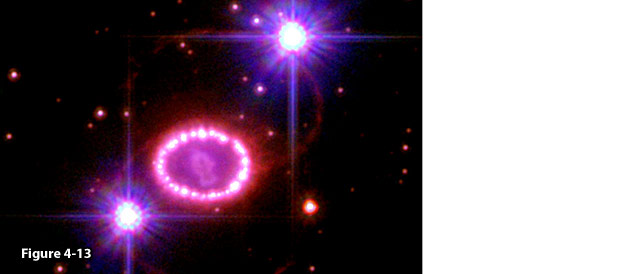
Figure
4-13: Supernova 1987A,
image credit: NASA, ESA,
P. Challis and R. Krishner (Harvard-Smithsonian Center of
Astrophysics); http://www.nasa.gov/multimedia/imagegallery/image
feature 773.html.
|